You built an app: a Next.js frontend, a FastAPI backend, a local LLM served by Ollama, and Postgres underneath. It works. Then someone asks “why did that request take 40 seconds?” and you realize you have no idea. Was it retrieval? One of the model calls? The database? All you have is a spinner and a vibe.
This post adds OpenTelemetry traces, metrics, and logs across the whole path, from a click in the browser to the token stream coming out of the model. The whole thing sits behind a single env var and is a true no-op when that var is unset, so local dev, tests, and CI never notice. Everything exports over OTLP to a Grafana LGTM stack (Loki, Grafana, Tempo, Mimir).
The shape of the problem
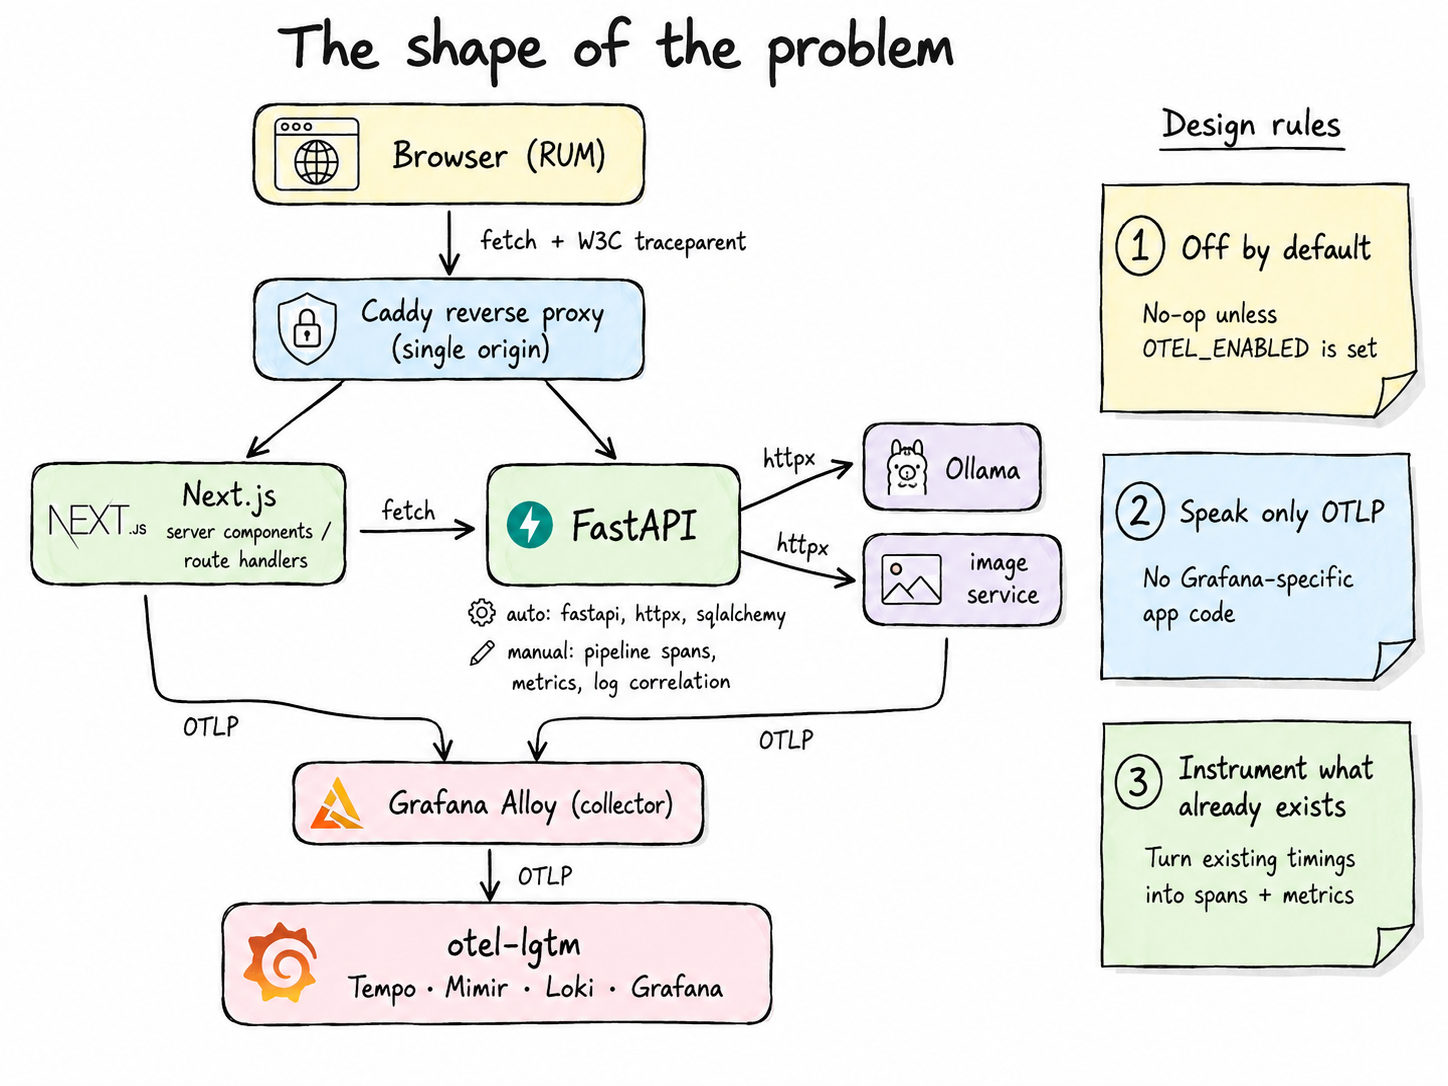
Three design rules made everything else easier:
- Off by default. A
configure_telemetry()call returns immediately unlessOTEL_ENABLEDis set. No providers installed, no handlers attached, zero overhead. The test pyramid never sees it. - Speak only OTLP. The app has no Grafana-specific code. The collector endpoint is an env var; swap the backend without touching the app.
- Instrument what already exists. A well-built app is already measuring itself: per-stage timings, token counts, DB calls. OTel mostly formalizes that into spans and metrics.
Backend: a gated bootstrap
The core is a single module (call it telemetry.py) with one entry point invoked from the
FastAPI lifespan. It imports OpenTelemetry lazily, so the module is safe to import even when
the optional otel dependency group isn’t installed.
def configure_telemetry(app, engine):
    settings = get_settings()
    if not settings.otel_enabled:
        return _runtime  # no-op

    resource = Resource.create({"service.name": settings.otel_service_name,
                                "service.version": app.version})

    # Traces
    tracer_provider = TracerProvider(resource=resource)
    tracer_provider.add_span_processor(BatchSpanProcessor(OTLPSpanExporter()))
    trace.set_tracer_provider(tracer_provider)

    # Metrics
    reader = PeriodicExportingMetricReader(OTLPMetricExporter())
    metrics.set_meter_provider(MeterProvider(resource=resource, metric_readers=[reader]))

    # Logs
    logger_provider = LoggerProvider(resource=resource)
    logger_provider.add_log_record_processor(BatchLogRecordProcessor(OTLPLogExporter()))
    set_logger_provider(logger_provider)

    # Auto-instrumentation
    FastAPIInstrumentor.instrument_app(app, excluded_urls="health,readiness",
                                       exclude_spans=["receive", "send"])
    HTTPXClientInstrumentor().instrument(request_hook=_name_httpx_span)
    SQLAlchemyInstrumentor().instrument(engine=engine.sync_engine)
Endpoint, protocol, and headers all come from the standard OTel env vars
(OTEL_EXPORTER_OTLP_ENDPOINT, OTEL_EXPORTER_OTLP_PROTOCOL, and so on), so there’s no custom
config surface to maintain.
exclude_spans=["receive", "send"] is worth calling out. Without it, a streaming endpoint emits
one ASGI span per chunk. That’s hundreds of spans burying the useful ones.
The hard part: tracing background work
Here’s the wrinkle that makes an LLM app different from a CRUD app: the expensive work doesn’t
run inside the request. The POST that kicks off a generation returns in about 70 ms after
queuing a detached asyncio task. The real pipeline (retrieval, several model calls,
persistence) runs for tens of seconds after the response is sent.
If you make the pipeline a child of the request span, the whole trace inherits the 40-second
duration, and your trace-derived request-latency metrics now think every POST takes 40 seconds.
The fix is a span link, not a parent/child edge:
# In the route handler, capture the request's span context and stash it on the task.
# In the background task, start a NEW root trace linked back to the request:
with telemetry.start_span("turn.generate", link_context=request_span_context, root=True):
    ...
Now the HTTP trace stays around 70 ms (clean RED metrics), and the pipeline gets its own trace whose duration reflects the actual work. The pipeline trace is a tidy waterfall:
turn.generate                      (its own trace, linked to the POST)
├── stage.retrieval   → LLM POST /api/embed
├── stage.world       → LLM POST /api/chat
├── stage.events      → LLM POST /api/chat
├── stage.character:… → LLM POST /api/chat
├── stage.narrator    → LLM POST /api/chat
└── stage.persistence → LLM POST /api/chat, LLM POST /api/embed …
Each stage is a manual span wrapped right next to the code that already records that stage’s
timing, so it’s a light touch with no logic change. The nested POST spans come for free from
the httpx auto-instrumentation.
Make the link bidirectional and you can hop either direction in Tempo: from the request that
queued the work to the work itself, and back. There’s also a trick that saves you from
link-clicking entirely. Stamp the same turn_id / session_id on both the request span and
the pipeline root, and a single Tempo search by turn_id lands you on whichever trace you want:
attrs = {"app.turn_id": turn_id, "app.session_id": session_id}
telemetry.set_current_span_attributes(attrs)                 # on the POST span
with telemetry.start_span("turn.generate", attributes=attrs, # on the pipeline root
                          link_context=request_span_context, root=True):
    ...
The deferred image render, yet another detached task, gets the same treatment: its own span, linked back to the turn that requested it. Every detached unit of work ends up one link away from its cause.
Metrics from what you already measure
The pipeline already accumulates a per-stage dict of {stage, model, wall_ms, prompt_tokens, eval_tokens}. Emitting metrics is then just reading that at the end of a turn. A handful of
instruments cover the domain:
turn_duration = meter.create_histogram("app.turn.duration", unit="ms")
llm_duration  = meter.create_histogram("app.llm.duration", unit="ms")   # by stage, model
llm_tokens    = meter.create_counter("app.llm.tokens")                  # by direction, model
turn_count    = meter.create_counter("app.turn.count")                  # by outcome
The one rule that matters: keep metric labels low-cardinality. Model, stage, and outcome are
fine. A session_id or turn_id on a metric label will blow up your time-series database.
Those belong on spans and logs, where high cardinality is the whole point.
Logs, correlated with traces
Route the standard logging tree to OTLP so log lines land in Loki stamped with the trace and span IDs of whatever span was active when they were emitted. That gives you one-click pivoting between a trace and its logs.
handler = LoggingHandler(level=logging.INFO, logger_provider=logger_provider)
for name in ("app", "uvicorn", "uvicorn.error", "uvicorn.access"):
    logging.getLogger(name).addHandler(handler)
LoggingInstrumentor().instrument()  # injects trace_id/span_id into records
Gotcha: uvicorn configures its own loggers with
propagate=False, so their access/error lines never reach the root handler. You have to attach the OTLP handler touvicorn.accessdirectly, or you’ll wonder why your request logs aren’t in Loki.
Enrich the important log points with structured attributes (session_id, turn_id) via
logger.info(..., extra={...}). Those become queryable fields on the log line.
Frontend: the true end-to-end
Two layers on the frontend, both gated by the same env.
Next.js server is one line of value: @vercel/otel traces server components and route
handlers, and, crucially, propagates traceparent on outgoing fetch to the backend, so
a server render and the API call it makes are one trace.
// instrumentation.ts
export async function register() {
  if (process.env.NEXT_RUNTIME !== "nodejs" || !telemetryEnabled()) return;
  const { registerOTel } = await import("@vercel/otel");
  registerOTel({ serviceName: "frontend" });
}
Browser RUM is where “end-to-end” becomes literal. A WebTracerProvider plus
FetchInstrumentation injects traceparent on /api/* calls, so the trace starts in the
browser:
provider.register({ contextManager: new ZoneContextManager() });
registerInstrumentations({
  instrumentations: [
    new FetchInstrumentation({ propagateTraceHeaderCorsUrls: [/\/api\//] }),
  ],
});
Two details cost real debugging time here:
ZoneContextManageris not optional. The default web context manager doesn’t carry the active span acrossawait. Without Zone, a “user clicked Generate” span won’t be the parent of the fetch it triggers, and your user-action span floats off in its own trace. With it, you get a single clean tree.- Wrap the meaningful user action in its own span so the trace reads from intent, not just transport:
export async function traceUiAction(name, attrs, fn) {
  const tracer = trace.getTracer("browser");
  return tracer.startActiveSpan(name, async (span) => {
    try { return await fn(); } finally { span.end(); }
  });
}
// submitTurn = () => traceUiAction("ui.generate_turn", { session_id }, () => fetch(...))
The payoff, verified in Tempo:
[browser]  ui.generate_turn
   [browser]  POST /api/sessions/{id}/turns
      [backend]  POST /api/sessions/{session_id}/turns
         [backend]  SELECT / INSERT …
One trace, two services, browser to database. The browser exporter posts to a same-origin
/otlp path that the reverse proxy forwards to the collector. No CORS, no separate public
endpoint.
Cross-service propagation
The reverse proxy (Caddy here) passes traceparent through untouched — it’s just a header — so
none of this needs proxy config beyond confirming it isn’t stripped. Ollama isn’t instrumented
(it’s third-party), but the httpx client span captures each call’s duration and status from
our side, which is all you need for latency attribution.
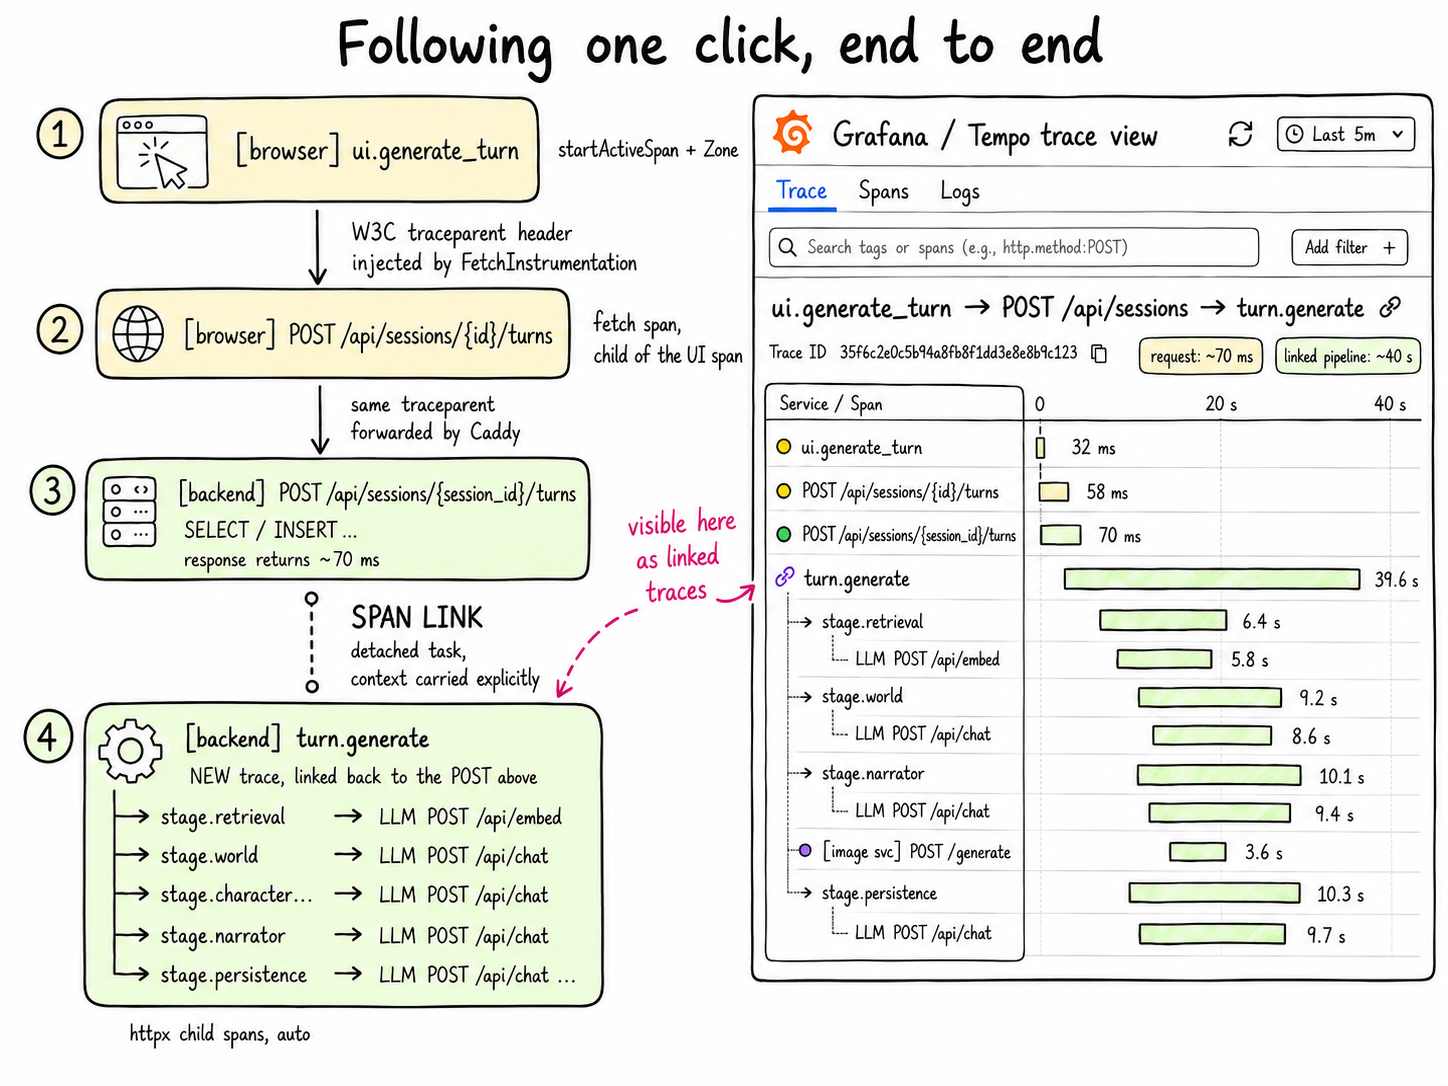
Following one click, end to end
This is the part that makes it all worth it, so let’s trace a single “Generate” click through every hop and name the exact mechanism that carries the context each time. There are only two mechanisms in the whole system, a header for synchronous calls and a link for asynchronous ones, and knowing which is which is the entire mental model.
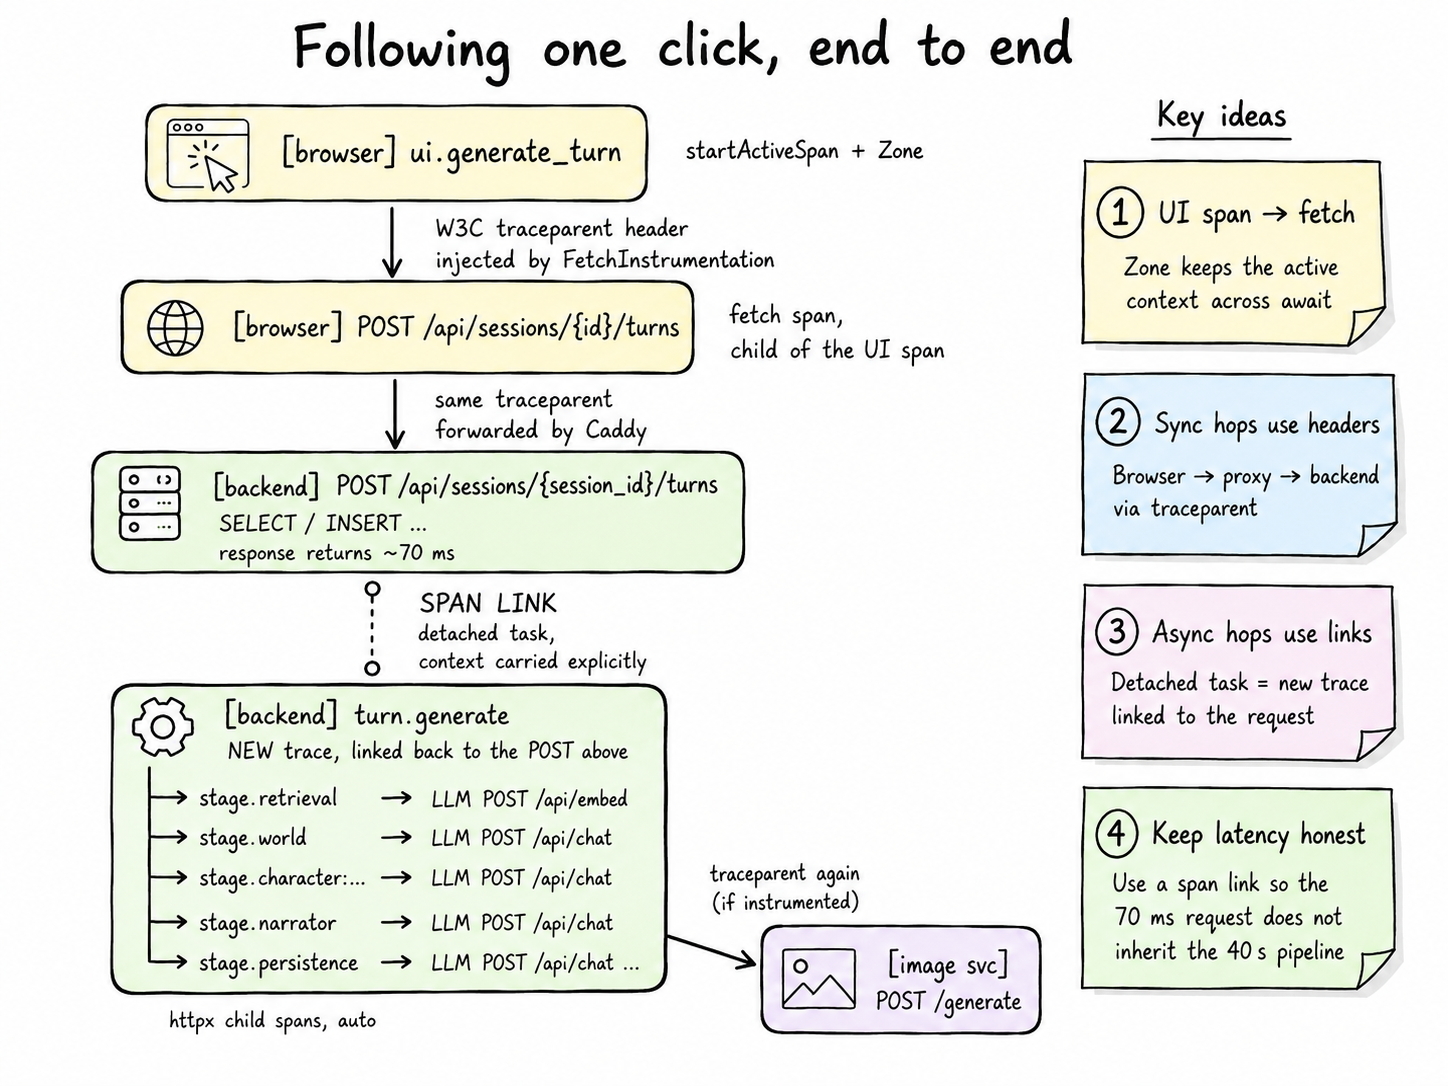
Read it top to bottom:
- Browser span → browser fetch.
startActiveSpan("ui.generate_turn", …)makes the ui span the active context; because aZoneContextManagerholds that context across theawait, theFetchInstrumentationsees it and makes the fetch span a child. No headers involved yet — this is in-process parent/child. - Browser → backend. The fetch instrumentation writes a W3C
traceparentheader onto the outgoing request:traceparent: 00-<trace-id>-<span-id>-01. Same-origin, so it just goes. - Through the proxy. Caddy forwards
/api/*straight to FastAPI, header intact. - Backend continuation.
FastAPIInstrumentorreadstraceparentand starts its server span as a child of the browser fetch span, sametrace-id. Browser and backend are now provably one trace. The handler writes the turn row and returns in ~70 ms. - The async jump. The pipeline runs in a detached task; there’s no request, no header to
ride. So we carry the request’s
SpanContextacross the boundary by hand and openturn.generateas a linked root of a new trace. Differenttrace-id, joined by a link, deliberately, to keep the request’s latency clean. - Inside the pipeline. Each stage span parents the httpx call underneath it automatically;
if the image service is instrumented,
traceparentpropagates one more hop across that httpx boundary and the render nests under the turn.
The result in Grafana: from a spike on the turn.duration metric you jump (via an exemplar)
to the offending turn.generate trace; from that trace you follow the link back to the exact
browser click that caused it; and from any span you click through to its correlated logs in
Loki by trace_id. Cause, effect, and evidence, three clicks apart, across four services.
Two things make this robust rather than fragile:
- The browser needs the async-aware context manager (Zone). Skip it and step 1 silently breaks: the fetch becomes its own root and the “click” is no longer attached to anything. This is the single most common way browser RUM ends up technically working but useless.
- The link direction is a choice with consequences. Parent/child would have been less code, but it would fold a 40-second pipeline into the request trace and poison every latency percentile derived from it. The link is the difference between honest RED metrics and a dashboard that says every request takes a minute.
Making spans actually readable
Auto-instrumentation gives you correct spans with useless names. Every model call shows up as
a bare POST; every query as SELECT. Two cheap hooks fix this.
Rename outbound httpx spans by path, and flag the LLM ones so they stand out from other API calls:
def _name_httpx_span(span, request):
    method, path = request.method, request.url.path
    is_llm = request.url.host == OLLAMA_HOST or path in OLLAMA_PATHS
    span.update_name(f"{'LLM ' if is_llm else ''}{method} {path}")
Give per-entity stages a suggestive name (stage.character:Eleanor instead of stage.character),
and rename the browser fetch span via applyCustomAttributesOnSpan so it reads POST /api/…
instead of HTTP POST. Small changes; the waterfall goes from cryptic to self-explanatory.
Cutting the noise
Health probes fire every few seconds and drown everything else. Kill them at three layers:
- Traces:
excluded_urls="health,readiness"on the FastAPI instrumentor drops the server span. - Logs: skip them in the request-logging middleware, and add a small
logging.Filteronuvicorn.accesssoGET /health 200never reaches Loki. - The sneaky one: once the server span is excluded, the probe’s own
SELECT 1becomes an orphan root span — a lonelySELECTin Tempo every 10 seconds. Wrap the probe’s DB work in a suppression context so no child spans are created either:
@router.get("/health")
async def healthcheck(...):
    with telemetry.suppress_instrumentation():
        await service.healthcheck(db)
    return {"status": "ok"}
After this, 16 probes produced zero spans, while a normal request still traced fully.
Collector and dashboards
A local Grafana Alloy collector receives OTLP and forwards to an all-in-one
grafana/otel-lgtm container (Tempo + Mimir + Loki + Grafana). It all lives in a separate
compose override you opt into, so the default docker compose up, tests, and CI stay clean:
docker compose -f docker-compose.yml -f docker-compose.otel.yml up
otel-lgtm serves Grafana on
:3000, which collides with a typical app proxy — remap it (e.g. publish on:3001).
Dashboards ship as JSON, auto-provisioned into a folder by mounting the directory into Grafana’s
provisioning path, so dropping a new *.json is all it takes to add one. Three boards: a
metrics board (turn/stage latency, tokens/sec, HTTP RED), a traces board (recent + user-action +
slow-stage tables), and a logs board with service/level template variables and a
volume-by-level chart.
Takeaways
- Gate the whole thing behind one env var and make it a true no-op. This is what lets you ship it without holding tests and CI hostage.
- For async/background work, reach for span links before parent/child. It keeps your request-latency signal honest.
- The browser tier is worth it, but only with an async-aware context manager.
- Auto-instrumentation gets you 80% for free; the last 20% (readable names, noise reduction, correct dashboard queries) is where the signal actually lives.
The end state: click “Generate,” and one trace follows it from the browser, through the frontend and backend, across every model call, into the database — with correlated logs one click away and latency/token metrics you can alert on. No more spinner-and-a-vibe.