In this article, we’ll walk through setting up a Docker-based ELK (Elasticsearch, Logstash, and Kibana) stack to collect, view, and send Docker logs.
services:
  elasticsearch:
    image: elasticsearch:7.17.24
    environment:
      - discovery.type=single-node
    volumes:
      - ./elasticsearch_data/:/usr/share/elasticsearch/data
    mem_limit: "1g"

  redis-cache:
    image: redis:7.4.0

  logstash-agent:
    image: logstash:7.17.24
    volumes:
      - ./logstash-agent:/etc/logstash
    command: logstash -f /etc/logstash/logstash.conf
    depends_on:
      - elasticsearch
    ports:
      - 12201:12201/udp

  logstash-central:
    image: logstash:7.17.24
    volumes:
      - ./logstash-central:/etc/logstash
    command: logstash -f /etc/logstash/logstash.conf
    depends_on:
      - elasticsearch

  kibana:
    image: kibana:7.17.24
    ports:
      - 5601:5601
    environment:
      - ELASTICSEARCH_HOSTS=http://elasticsearch:9200
    depends_on:
      - elasticsearch
ElasticSearch
Just create a folder named elasticsearch_data for storing data.
Logstash Central
This container’s role is to receive events from Redis and forward them to Elasticsearch.
Create a file named logstash-central\logstash.conf with the following content:
input {
    redis {
        host => "redis-cache"
        type => "redis-input"
        data_type => "list"
        key => "logstash"
    }
}

output {
    elasticsearch {
        hosts => ["elasticsearch:9200"]
    }
}
Logstash Agent
This container will receive application events and forward them to Redis, which acts as a buffer/queue.
Create a file named logstash-agent\logstash.conf with the following content:
input {
    gelf {
        port => 12201
    }
}

filter {
    grok {
      match => { "message" => "%{TIMESTAMP_ISO8601:timestamp} \[%{DATA:thread}\] \[%{DATA:string_level}\] %{GREEDYDATA:message}" }
    }
}

output {
    redis {
        host => "redis-cache"
        data_type => "list"
        key => "logstash"
    }
}
In our case, we want to parse logs from a Python app, setting the timestamp, thread, and a new field named string_level (since level is a numeric field in Elasticsearch).
GitIgnore
In case you want to store the configuration files in Git, here is how I set up the .gitignore to exclude all the files and folders in elasticsearch_data.
Add this to .gitignore :
# exception to the rule
!elasticsearch_data/.gitignore

# # exclude everything
elasticsearch_data
Lastly, create an empty file named elasticsearch_data/.gitkeep to ensure Git tracks this directory.
Run ELK
We just need to start Docker Compose :
docker compose up
And after a few minutes, we can open the kibana UI http://localhost:5601/.
Define logging index
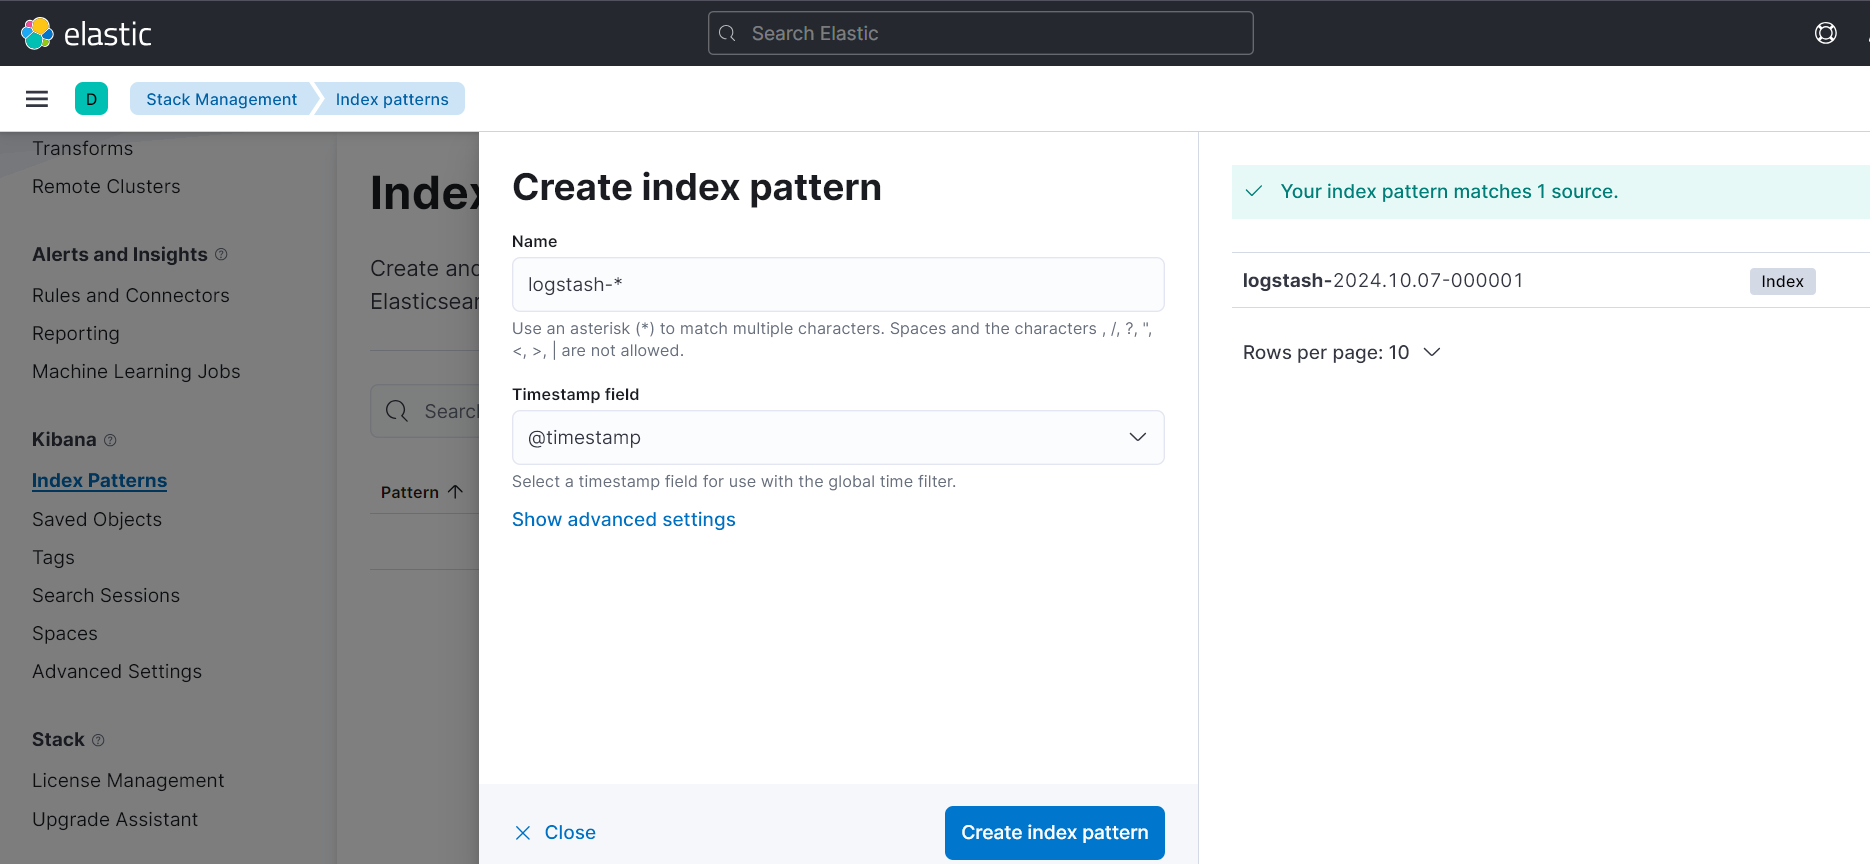
We also need to define an index with the pattern logstash-* in order to search logs in ELK.

Sample python app config
For testing purposes, let’s attach logging to a sample Python app by adding the following configuration to the Docker Compose file:
    logging:
      driver: gelf
      options:
        gelf-address: "udp://localhost:12201" # Logstash UDP input port
        tag: "myapp"
    restart: unless-stopped
Of course, this configuration can be added to the database container as well.
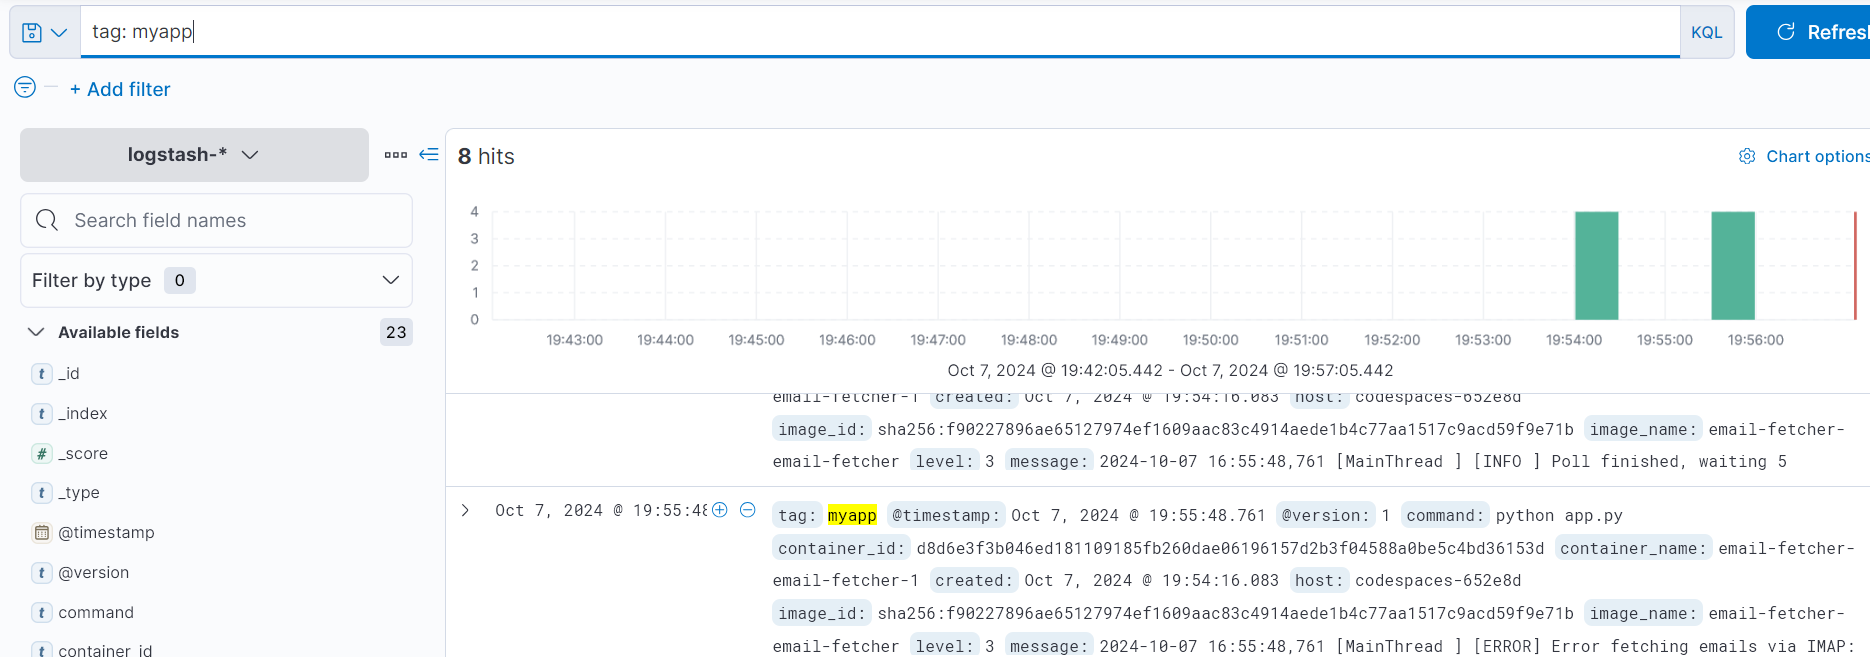
If everything is ok, we can see the application logs:

And the PostgreSQL logs as well:

With this setup, you’ll now be able to visualize and manage your Docker logs using ELK, making it easier to monitor and debug your applications.